Ever wished you could just ask your data questions in plain English and get instant, intelligent answers?
With Microsoft Fabric’s new Data Agent, that’s not just possible, it’s powerful.
In this post, I’ll walk you through how I built a Fabric Data Agent on top of the standard AdventureWorksDW dataset, and how you can too, even if you’re a complete beginner.
TL;DR
Microsoft Fabric’s Data Agent lets you ask questions about your data in natural language; no SQL, DAX, or visuals required. Think of it like a chat-based analyst that already knows your data model and never sleeps. This article walks you through building a Data Agent on top of AdventureWorksDW, writing agent instructions, adding data sources, and exploring advanced use cases like AI Foundry and multi-agent systems. By the end, you’ll be able to create your own interactive AI analyst in under 30 minutes.
Prerequisites:
1. You must have access to Microsoft Fabric Capacity specifically F2 or higher.
2. Only workspaces with Fabric-enabled capacity will show the “AI Agent” option in the “+ New” menu.
3.Your Fabric admin must enable the Data Agent preview in the Tenant Settings within the Microsoft Fabric Admin Portal. if you don’t have admin rights, contact your admin.
How to Create a Data Agent in Microsoft Fabric
If you’ve never done this before, don’t worry. Here’s a simple step-by-step guide.
Step 1: Open the Microsoft Fabric Workspace
- Go to https://app.fabric.microsoft.com.
- Select or create a new Workspace where your Lakehouse is located.
Step 2: Create a Lakehouse (if not already done)
- Click New > Lakehouse and give it a name (e.g.,
demolakehouse). - Add your data using Shortcuts:
- Go to the Tables pane inside the Lakehouse.
- Click Add Shortcut > OneLake data.
- Browse and select the relevant tables (e.g., from AdventureWorksDW).
I used the classic AdventureWorksDW dataset, the same one you’ve probably seen in BI demos. Instead of importing tables manually, I used OneLake Shortcuts, which connect existing data without duplicating it.
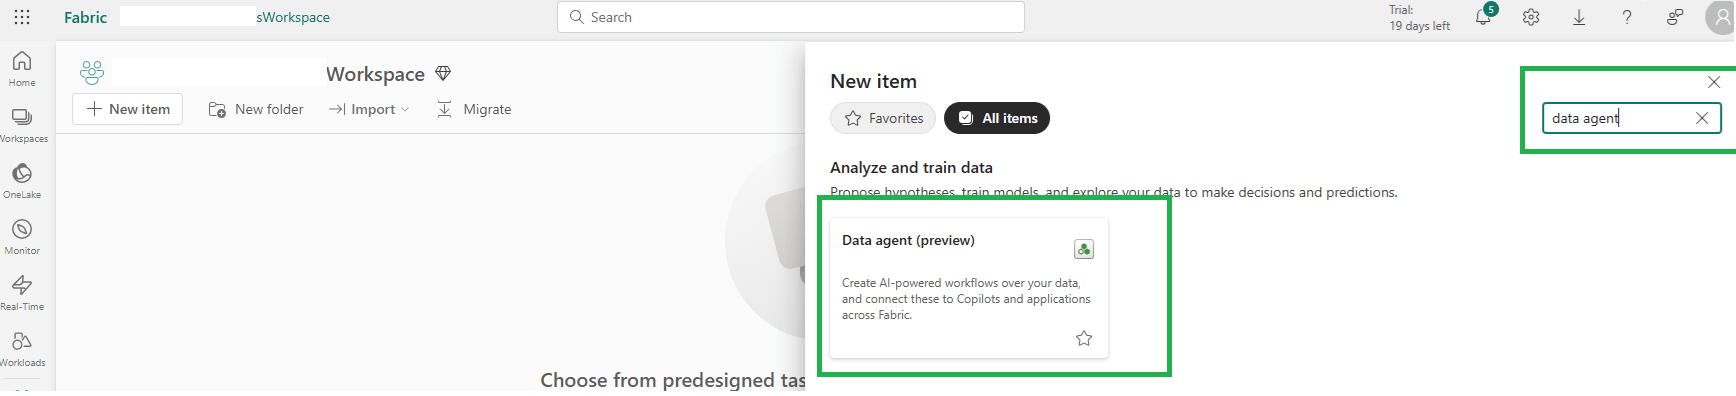
Step 3: Create the Data Agent
- In your workspace, click New > Data agent (preview).
- Choose the Lakehouse where your data is stored. You can also choose semantic model in case you have created semantic model on top of your lakehouse.
- Give your agent a name (e.g.,
Sales Insights Agent). - Click Create — this opens the agent configuration screen.
Step 4: Add a Data Source to the Data Agent
Once the agent is created, you’ll need to give it instructions and connect it to your data.
- Inside the agent editor, go to the Data Sources tab.
- Click + Add data source and choose the
Lakehouseas shown in the image below.
Step 5: Add the Agent Instructions
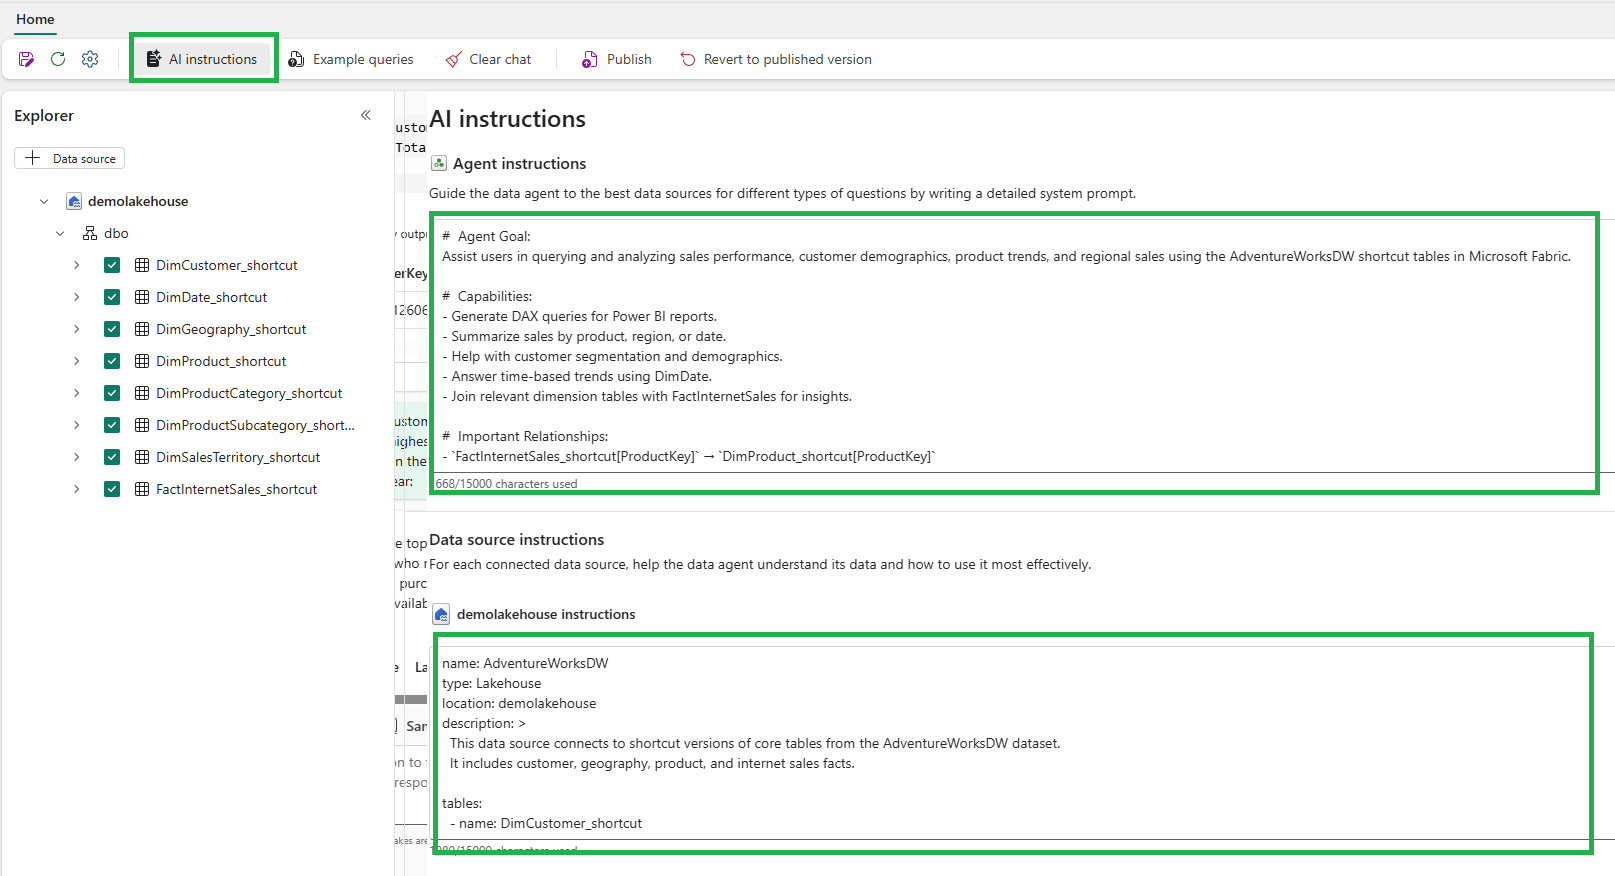
- Go to the Agent Instructions tab.
- Provide instuctions for the data agent about it’s goal and responsibilities.
Goal:
Assist users in analyzing sales, customers, geography, and product performance.

Key Relationships:
- FactInternetSales ➡ ProductKey ➡ DimProduct ➡ Subcategory ➡ Category
- FactInternetSales ➡ CustomerKey ➡ DimCustomer ➡ Geography
- FactInternetSales ➡ OrderDateKey ➡ DimDate

Ask me things like:
- Top-selling categories last year?
- Sales trend in Q1 2024?
- Which cities had highest average order size?

Answer in charts, tables, or summaries where helpful.
Step 6: Add the Data Source Instructions
- Add the data source instruction to let data agent understand your data model.
yamlCopyEditname: AdventureWorksDW_Shortcut
type: Lakehouse
tables:
  - name: DimCustomer_shortcut
    description: Customer demographics and keys
  - name: DimDate_shortcut
    description: Calendar date dimension
  - name: DimProduct_shortcut
    description: Product attributes
  - name: DimProductCategory_shortcut
    description: Categories of products
  - name: DimProductSubcategory_shortcut
    description: Subcategories of products
  - name: DimGeography_shortcut
    description: Country, state, and city details
  - name: FactInternetSales_shortcut
    description: Sales facts including sales amount, quantity, and dates

Step 7: Test the Agent and fine tunning
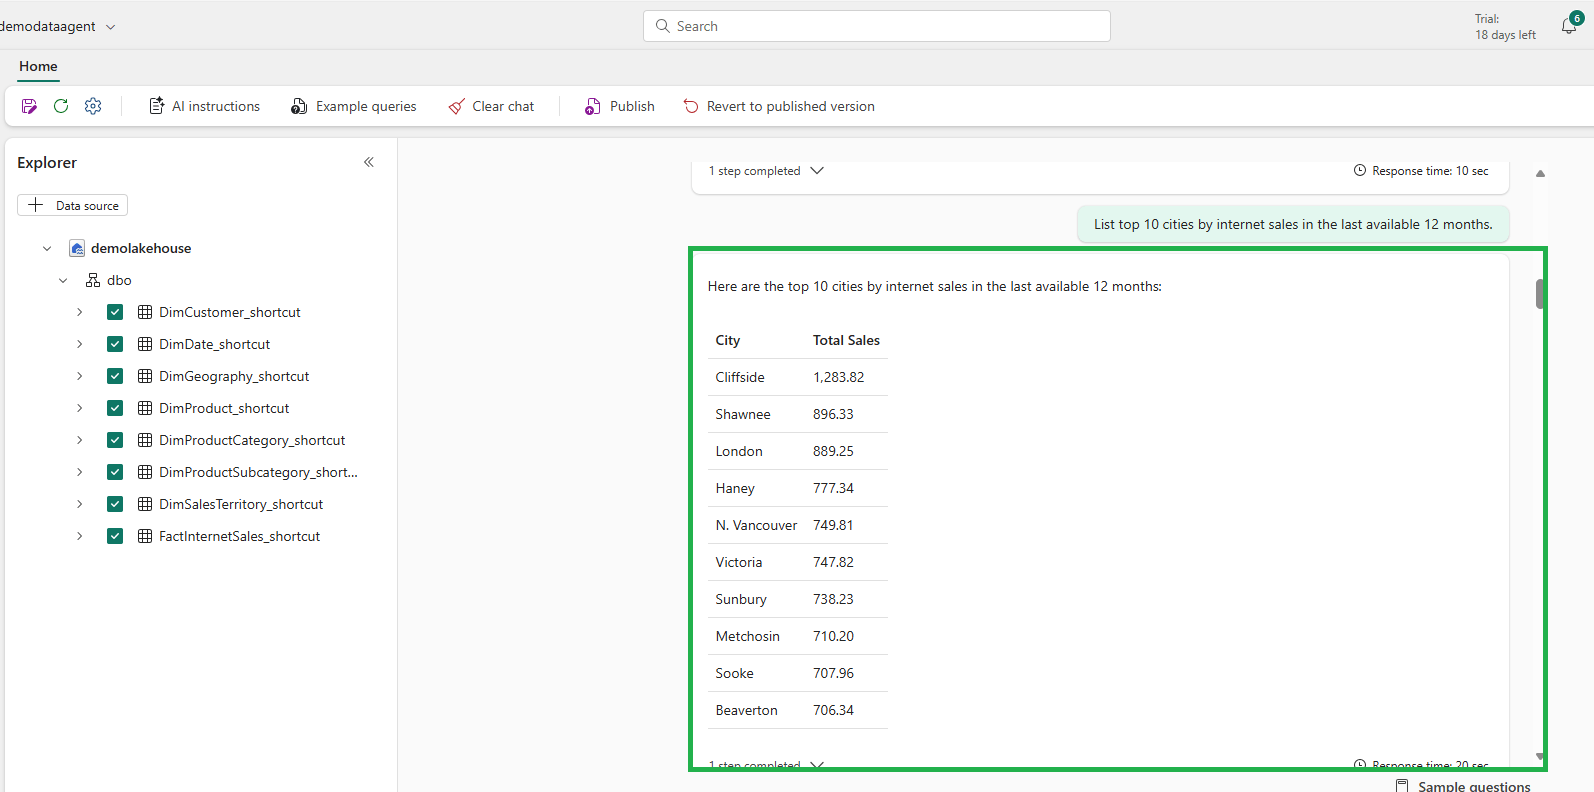
Start asking questions to the agent like;
1. List top 10 cities by internet sales in last available 12 months.
2. List top 5 customers who made the highest purchases in the latest available year:
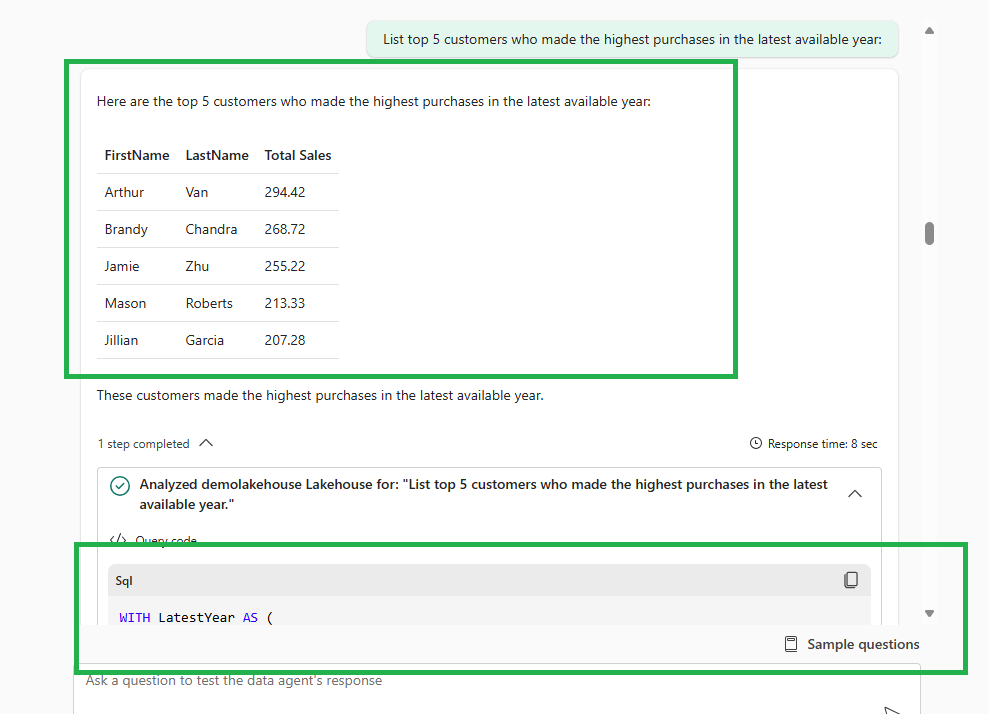
Notice that it also provides the SQL query it has executed on the lakehouse to get the required output.
If the data source and instructions are set correctly, the agent should respond with meaningful tables or summaries. In case you observe issues in the responses, you may need to fine tune the AI instructions and test again.
When Should You Use Data Agents?
If you’re already using:
- A well-modeled star schema
- Lakehouse tables or Delta format
- Power BI reports or semantic models
- Microsoft Fabric workspaces with clean relationships
Then a Data Agent will act like a bridge between your data and your business users. No technical barrier — just questions and answers.
Integrations and Advanced Use Cases
What makes Fabric Data Agents truly powerful is not just that they can answer questions — but that they can plug into larger AI and data ecosystems. Here are a few ways to take your agent to the next level.
1. Integration with Azure AI Foundry
Microsoft Azure’s AI Foundry allows you to orchestrate LLM-driven pipelines, combine ML models with data operations, and deploy custom copilots. Your Data Agent can be used here in multiple ways:
- As a ready knowledge base within Foundry apps
- To summarize and explain insights from streaming or batch pipelines
- As a modular AI skill within a larger orchestrated flow
For example, you could use the agent to automatically generate weekly sales summaries and send them via email to business users — no dashboards needed.
2. Use in Multi-Agent Systems with Copilot Studio
Microsoft recently announced integration of Fabric data agent with Copilot Studio. This means data agent also supports multi-agent patterns where different agents work together, each specializing in their role.
Your Data Agent can act as:
- A domain expert (e.g., Sales Agent, Inventory Agent)
- A knowledge base that other agents query
- A collaborative AI alongside others like a document reader, chatbot, or metric generator
Example: Multi-Agent Use Case
Imagine a scenario where you’ve built:
- A “Sales Insights Agent” (based on the Sales model)
- A “Customer Sentiment Agent” (that reads survey data or feedback documents)
- A “Decision Support Agent” (that aggregates insights from both)
Now, a user asks the Decision Support Agent:
“Should we invest more in red-colored bikes for Q3 promotions?”
Here’s what happens behind the scenes:
- The Sales Agent looks up sales trends for red bikes from your Data Agent.
- The Sentiment Agent checks recent customer feedback about product quality or color preferences.
- The Decision Agent combines both and generates a recommendation — backed by data and context.
This makes your Data Agent a building block in a broader AI ecosystem, not just a standalone tool.
Final Thoughts
Data Agents in Fabric aren’t just experimental toys; they’re fully capable assistants for real business scenarios. Whether you’re a data engineer, analyst, or decision maker, you’ll find value in being able to converse with your data.
For me, this agent worked perfectly with the AdventureWorksDW model and started answering meaningful business questions within minutes, no DAX, no Power BI visuals, no joins to write.
This service is currently in preview. It does not currently render charts. Hopefully, future updates will enable it to generate Power BI level visuals on the fly.
See more
Pro tips:
1. Learn how to integrate Microsoft Copilot in SQL Server Management Studio 21.
Kunal Rathi
With over 14 years of experience in data engineering and analytics, I've assisted countless clients in gaining valuable insights from their data. As a dedicated supporter of Data, Cloud and DevOps, I'm excited to connect with individuals who share my passion for this field. If my work resonates with you, we can talk and collaborate.